FloaterHormannInterpolator#
- class scipy.interpolate.FloaterHormannInterpolator(points, values, *, d=3)[source]#
Floater-Hormann 重心有理插值。
如 [1] 所述,Floater 和 Hormann 的方法計算重心有理插值的權重,該插值在實軸上沒有極點。
- 參數:
- x1D 類陣列 (array_like),形狀 (n,)
包含自變數值的 1 維陣列。值可以是實數或複數,但必須是有限的。
- y類陣列 (array_like),形狀 (n, …)
包含應變數值的陣列。values 的無限值和 NaN 值,以及 x 的對應值將被捨棄。
- d整數 (int),選用
將
n - d個 d 次多項式混合在一起。對於d = n - 1,它等同於多項式插值。必須滿足0 <= d < n,預設值為 3。
註解
Floater-Hormann 插值器是一個有理函數,它以 \(O(h^{d+1})\) 的逼近階數內插數據。有理函數將
n - d個 d 次多項式混合在一起,以產生一個在實軸上沒有極點的有理插值器,這與AAA不同。插值器由下式給出\[r(x) = \frac{\sum_{i=0}^{n-d} \lambda_i(x) p_i(x)} {\sum_{i=0}^{n-d} \lambda_i(x)},\]where \(p_i(x)\) is an interpolating polynomials of at most degree d through the points \((x_i,y_i),\dots,(x_{i+d},y_{i+d}), and :math:\)lambda_i(z)` are blending functions defined by
\[\lambda_i(x) = \frac{(-1)^i}{(x - x_i)\cdots(x - x_{i+d})}.\]When
d = n - 1this reduces to polynomial interpolation.Due to its stability following barycentric representation of the above equation is used instead for computation
\[r(z) = \frac{\sum_{k=1}^m\ w_k f_k / (x - x_k)}{\sum_{k=1}^m w_k / (x - x_k)},\]where the weights \(w_j\) are computed as
\[\begin{split}w_k &= (-1)^{k - d} \sum_{i \in J_k} \prod_{j = i, j \neq k}^{i + d} 1/|x_k - x_j|, \\ J_k &= \{ i \in I: k - d \leq i \leq k\},\\ I &= \{0, 1, \dots, n - d\}.\end{split}\]參考文獻
[1]M.S. Floater and K. Hormann, “Barycentric rational interpolation with no poles and high rates of approximation”, Numer. Math. 107, 315 (2007). DOI:10.1007/s00211-007-0093-y
範例
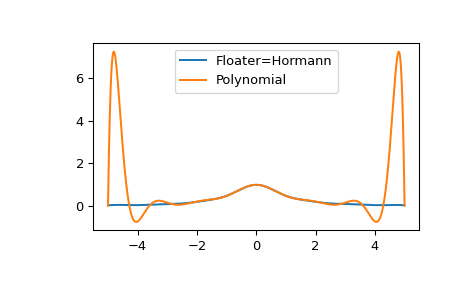
在這裡,我們將此方法與多項式插值進行比較,以展示在 Runge 現象下多項式插值失敗的範例。
>>> import numpy as np
>>> from scipy.interpolate import (FloaterHormannInterpolator,
...                                BarycentricInterpolator)
>>> def f(z):
...     return 1/(1 + z**2)
>>> z = np.linspace(-5, 5, num=15)
>>> r = FloaterHormannInterpolator(z, f(z))
>>> p = BarycentricInterpolator(z, f(z))
>>> zz = np.linspace(-5, 5, num=1000)
>>> import matplotlib.pyplot as plt
>>> fig, ax = plt.subplots()
>>> ax.plot(zz, r(zz), label="Floater=Hormann")
>>> ax.plot(zz, p(zz), label="Polynomial")
>>> ax.legend()
>>> plt.show()
- 屬性:
- weights陣列 (array)
重心逼近的權重。
方法
__call__(z)在給定值下評估有理逼近。
poles()計算有理逼近的極點。
residues()計算逼近極點的殘值。
roots()計算有理逼近的零點。