scipy.special.gdtr#
- scipy.special.gdtr(a, b, x, out=None) = <ufunc 'gdtr'>#
Gamma 分布累積分布函數。
返回從零到 x 的 gamma 機率密度函數的積分,
\[F = \int_0^x \frac{a^b}{\Gamma(b)} t^{b-1} e^{-at}\,dt,\]其中 \(\Gamma\) 是 gamma 函數。
- 參數:
- aarray_like
gamma 分布的速率參數,有時表示為 \(\beta\) (float)。它也是尺度參數 \(\theta\) 的倒數。
- barray_like
gamma 分布的形狀參數,有時表示為 \(\alpha\) (float)。
- xarray_like
分位數(積分上限;float)。
- outndarray, optional
函數值的可選輸出陣列
- 返回:
- Fscalar or ndarray
在 x 處評估的具有參數 a 和 b 的 gamma 分布的 CDF。
參見
gdtrcgamma 分布的 1 - CDF。
scipy.stats.gammaGamma 分布
註解
評估是使用與不完全 gamma 積分(正則化 gamma 函數)的關係進行的。
Cephes [1] 常式
gdtr的包裝函式。直接調用gdtr可以提高效能,相較於scipy.stats.gamma的cdf方法(請參閱下面的最後一個範例)。參考文獻
[1]Cephes Mathematical Functions Library, http://www.netlib.org/cephes/
範例
計算
a=1、b=2在x=5時的函數值。>>> import numpy as np >>> from scipy.special import gdtr >>> import matplotlib.pyplot as plt >>> gdtr(1., 2., 5.) 0.9595723180054873
通過為 x 提供 NumPy 陣列,計算
a=1和b=2在多個點的函數值。>>> xvalues = np.array([1., 2., 3., 4]) >>> gdtr(1., 1., xvalues) array([0.63212056, 0.86466472, 0.95021293, 0.98168436])
gdtr可以通過為 a、b 和 x 提供廣播兼容形狀的陣列來評估不同的參數集。在這裡,我們計算三個不同 a 在四個位置 x 和b=3的函數值,結果得到一個 3x4 陣列。>>> a = np.array([[0.5], [1.5], [2.5]]) >>> x = np.array([1., 2., 3., 4]) >>> a.shape, x.shape ((3, 1), (4,))
>>> gdtr(a, 3., x)
array([[0.01438768, 0.0803014 , 0.19115317, 0.32332358],
       [0.19115317, 0.57680992, 0.82642193, 0.9380312 ],
       [0.45618688, 0.87534798, 0.97974328, 0.9972306 ]])
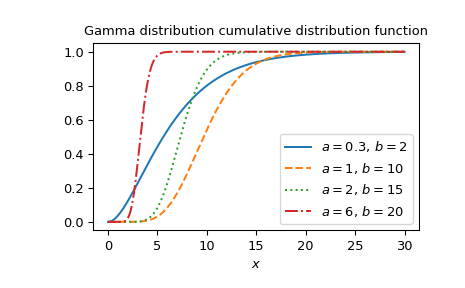
繪製四個不同參數集的函數圖。
>>> a_parameters = [0.3, 1, 2, 6]
>>> b_parameters = [2, 10, 15, 20]
>>> linestyles = ['solid', 'dashed', 'dotted', 'dashdot']
>>> parameters_list = list(zip(a_parameters, b_parameters, linestyles))
>>> x = np.linspace(0, 30, 1000)
>>> fig, ax = plt.subplots()
>>> for parameter_set in parameters_list:
...     a, b, style = parameter_set
...     gdtr_vals = gdtr(a, b, x)
...     ax.plot(x, gdtr_vals, label=fr"$a= {a},\, b={b}$", ls=style)
>>> ax.legend()
>>> ax.set_xlabel("$x$")
>>> ax.set_title("Gamma distribution cumulative distribution function")
>>> plt.show()
gamma 分布也可作為
scipy.stats.gamma使用。直接使用gdtr可能比調用scipy.stats.gamma的cdf方法快得多,特別是對於小陣列或個別值。要獲得相同的結果,必須使用以下參數化:stats.gamma(b, scale=1/a).cdf(x)=gdtr(a, b, x)。>>> from scipy.stats import gamma >>> a = 2. >>> b = 3 >>> x = 1. >>> gdtr_result = gdtr(a, b, x) # this will often be faster than below >>> gamma_dist_result = gamma(b, scale=1/a).cdf(x) >>> gdtr_result == gamma_dist_result # test that results are equal True