make_interp_spline#
- scipy.interpolate.make_interp_spline(x, y, k=3, t=None, bc_type=None, axis=0, check_finite=True)[source]#
計算插值 B 樣條(的係數)。
- 參數:
- xarray_like,形狀 (n,)
橫座標。
- yarray_like,形狀 (n, …)
縱座標。
- kint,可選
B 樣條次數。預設為三次,
k = 3。- tarray_like,形狀 (nt + k + 1,),可選。
節點。節點數量需要與資料點數量以及邊緣的導數數量一致。具體來說,
nt - n必須等於len(deriv_l) + len(deriv_r)。- bc_type2 元組或 None
邊界條件。預設為 None,表示自動選擇邊界條件。否則,它必須是一個長度為 2 的元組,其中第一個元素(
deriv_l)設定x[0]處的邊界條件,第二個元素(deriv_r)設定x[-1]處的邊界條件。它們中的每一個都必須是成對的迭代器(order, value),其給出指定階導數在插值區間給定邊緣的值。或者,可以識別以下字串別名"clamped":端點處的一階導數為零。這等效於等效於
bc_type=([(1, 0.0)], [(1, 0.0)])。
"natural":端點處的二階導數為零。這等效於bc_type=([(2, 0.0)], [(2, 0.0)])。"not-a-knot"(預設):第一個和第二個線段是相同的多項式。這等效於設定bc_type=None。"periodic":端點處的值和前k-1個導數是等效的。
- axisint,可選
插值軸。預設為 0。
- check_finitebool,可選
是否檢查輸入陣列是否僅包含有限數字。停用可能會提高效能,但如果輸入包含無限或 NaN,則可能會導致問題(崩潰、非終止)。預設為 True。
- 返回:
- bdegree 為
k且節點為t的 BSpline 物件。
- bdegree 為
參見
BSpline表示 B 樣條物件的基底類別
CubicSpline多項式基底中的三次樣條
make_lsq_spline用於樣條擬合的類似工廠函數
UnivariateSplineFITPACK 樣條擬合常式之上的包裝器
splrepFITPACK 樣條擬合常式之上的包裝器
範例
在 Chebyshev 節點上使用三次插值
>>> import numpy as np
>>> import matplotlib.pyplot as plt
>>> def cheb_nodes(N):
...     jj = 2.*np.arange(N) + 1
...     x = np.cos(np.pi * jj / 2 / N)[::-1]
...     return x
>>> x = cheb_nodes(20)
>>> y = np.sqrt(1 - x**2)
>>> from scipy.interpolate import BSpline, make_interp_spline
>>> b = make_interp_spline(x, y)
>>> np.allclose(b(x), y)
True
請注意,預設是具有 not-a-knot 邊界條件的三次樣條
>>> b.k
3
在這裡,我們使用「natural」樣條,邊緣處的二階導數為零
>>> l, r = [(2, 0.0)], [(2, 0.0)]
>>> b_n = make_interp_spline(x, y, bc_type=(l, r))  # or, bc_type="natural"
>>> np.allclose(b_n(x), y)
True
>>> x0, x1 = x[0], x[-1]
>>> np.allclose([b_n(x0, 2), b_n(x1, 2)], [0, 0])
True
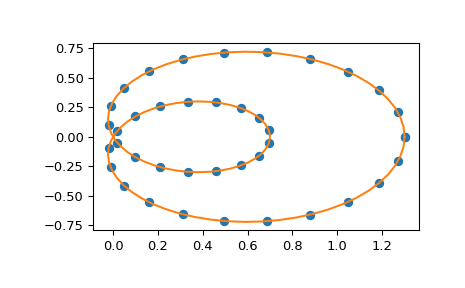
也支援參數曲線的插值。作為範例,我們計算極座標中蝸牛曲線的離散化
>>> phi = np.linspace(0, 2.*np.pi, 40)
>>> r = 0.3 + np.cos(phi)
>>> x, y = r*np.cos(phi), r*np.sin(phi)  # convert to Cartesian coordinates
構建插值曲線,通過角度參數化它
>>> spl = make_interp_spline(phi, np.c_[x, y])
在更精細的網格上評估插值器(請注意,我們轉置結果以將其解包為一對 x 和 y 陣列)
>>> phi_new = np.linspace(0, 2.*np.pi, 100)
>>> x_new, y_new = spl(phi_new).T
繪製結果
>>> plt.plot(x, y, 'o')
>>> plt.plot(x_new, y_new, '-')
>>> plt.show()
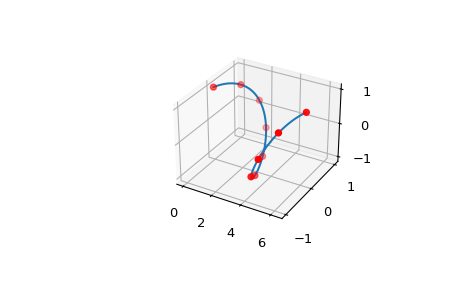
構建具有 2 維 y 的 B 樣條曲線
>>> x = np.linspace(0, 2*np.pi, 10)
>>> y = np.array([np.sin(x), np.cos(x)])
週期性條件滿足,因為端點上點的 y 座標是等效的
>>> ax = plt.axes(projection='3d')
>>> xx = np.linspace(0, 2*np.pi, 100)
>>> bspl = make_interp_spline(x, y, k=5, bc_type='periodic', axis=1)
>>> ax.plot3D(xx, *bspl(xx))
>>> ax.scatter3D(x, *y, color='red')
>>> plt.show()