scipy.interpolate.
krogh_interpolate#
- scipy.interpolate.krogh_interpolate(xi, yi, x, der=0, axis=0)[原始碼]#
用於多項式內插的便利函數。
詳情請參閱
KroghInterpolator。- 參數:
- xiarray_like
內插點(已知的 x 座標)。
- yiarray_like
已知的 y 座標,形狀為
(xi.size, R)。解讀為長度為 R 的向量,或如果 R=1 則為純量。- xarray_like
要評估導數的點或點集合。
- derint 或 list 或 None,選填
要評估多少階導數,或 None 表示所有可能的非零導數(即,一個等於點數的數字),或要評估的導數列表。此數字包含作為「第 0 階」導數的函數值。
- axisint,選填
yi 陣列中對應於 x 座標值的軸。
- 返回:
- dndarray
如果內插器的值是 R-D,則返回的陣列將是 導數數量 x N x R。如果 x 是純量,則中間維度將被捨棄;如果 yi 是純量,則最後一個維度將被捨棄。
另請參閱
KroghInterpolatorKrogh 內插器
註解
建構內插多項式是一個相對昂貴的過程。如果您想要重複評估它,請考慮使用 KroghInterpolator 類別(此函數即使用此類別)。
範例
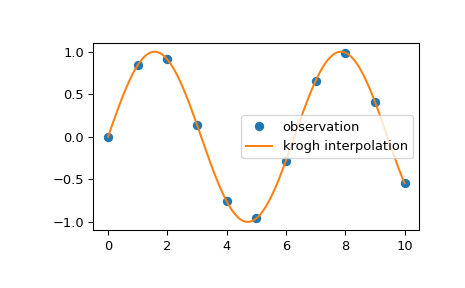
我們可以利用 Krogh 內插法來內插 2D 觀測資料
>>> import numpy as np
>>> import matplotlib.pyplot as plt
>>> from scipy.interpolate import krogh_interpolate
>>> x_observed = np.linspace(0.0, 10.0, 11)
>>> y_observed = np.sin(x_observed)
>>> x = np.linspace(min(x_observed), max(x_observed), num=100)
>>> y = krogh_interpolate(x_observed, y_observed, x)
>>> plt.plot(x_observed, y_observed, "o", label="observation")
>>> plt.plot(x, y, label="krogh interpolation")
>>> plt.legend()
>>> plt.show()