scipy.stats.
yeojohnson#
- scipy.stats.yeojohnson(x, lmbda=None)[原始碼]#
傳回經 Yeo-Johnson 冪轉換的資料集。
- 參數:
- xndarray
輸入陣列。應為一維。
- lmbdafloat,選用
如果
lmbda為None,則尋找最大化對數概似函數的 lambda,並將其作為第二個輸出引數傳回。否則,轉換將針對給定值完成。
- 傳回:
- yeojohnson:ndarray
Yeo-Johnson 冪轉換陣列。
- maxlogfloat,選用
如果 lmbda 參數為 None,則第二個傳回的引數是最大化對數概似函數的 lambda。
註解
Yeo-Johnson 轉換由下式給出
y = ((x + 1)**lmbda - 1) / lmbda,                for x >= 0, lmbda != 0
    log(x + 1),                                  for x >= 0, lmbda = 0
    -((-x + 1)**(2 - lmbda) - 1) / (2 - lmbda),  for x < 0, lmbda != 2
    -log(-x + 1),                                for x < 0, lmbda = 2
與
boxcox不同,yeojohnson不需要輸入資料為正數。在 1.2.0 版本中新增。
參考文獻
I. Yeo 和 R.A. Johnson,“A New Family of Power Transformations to Improve Normality or Symmetry”,Biometrika 87.4 (2000)
範例
>>> from scipy import stats
>>> import matplotlib.pyplot as plt
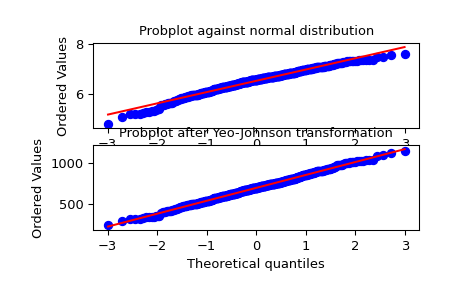
我們從非常態分佈產生一些隨機變數,並為其製作機率圖,以顯示其在尾部是非常態的
>>> fig = plt.figure()
>>> ax1 = fig.add_subplot(211)
>>> x = stats.loggamma.rvs(5, size=500) + 5
>>> prob = stats.probplot(x, dist=stats.norm, plot=ax1)
>>> ax1.set_xlabel('')
>>> ax1.set_title('Probplot against normal distribution')
我們現在使用
yeojohnson轉換資料,使其最接近常態>>> ax2 = fig.add_subplot(212) >>> xt, lmbda = stats.yeojohnson(x) >>> prob = stats.probplot(xt, dist=stats.norm, plot=ax2) >>> ax2.set_title('Probplot after Yeo-Johnson transformation')
>>> plt.show()