scipy.stats.
truncate#
- scipy.stats.truncate(X, lb=-inf, ub=inf)[原始碼]#
截斷隨機變數的支撐域。
給定一個隨機變數 X,
truncate返回一個隨機變數,其支撐域被截斷到 lb 和 ub 之間的區間。底層的機率密度函數會相應地正規化。- 參數:
- XContinuousDistribution
要截斷的隨機變數。
- lb, ubfloat array-like
分別為下限和上限截斷點。必須與彼此和 X 的形狀可廣播。
- 返回:
- XContinuousDistribution
截斷後的隨機變數。
參考文獻
[1]“截斷分佈”。維基百科。 https://en.wikipedia.org/wiki/Truncated_distribution
範例
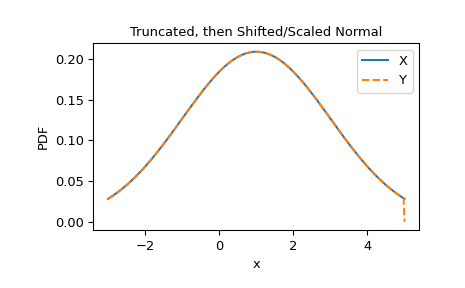
與
scipy.stats.truncnorm比較,它截斷標準常態分佈,然後平移和縮放它。>>> import numpy as np >>> import matplotlib.pyplot as plt >>> from scipy import stats >>> loc, scale, lb, ub = 1, 2, -2, 2 >>> X = stats.truncnorm(lb, ub, loc, scale) >>> Y = scale * stats.truncate(stats.Normal(), lb, ub) + loc >>> x = np.linspace(-3, 5, 300) >>> plt.plot(x, X.pdf(x), '-', label='X') >>> plt.plot(x, Y.pdf(x), '--', label='Y') >>> plt.xlabel('x') >>> plt.ylabel('PDF') >>> plt.title('Truncated, then Shifted/Scaled Normal') >>> plt.legend() >>> plt.show()
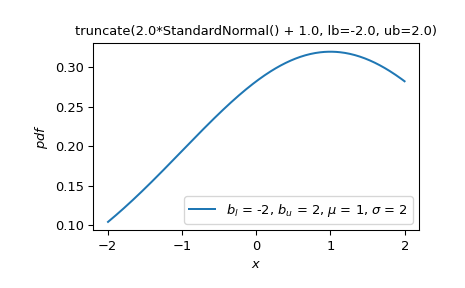
然而,假設我們希望平移和縮放一個常態隨機變數,然後將其支撐域截斷為給定值。使用
truncate可以直接做到。>>> Z = stats.truncate(scale * stats.Normal() + loc, lb, ub) >>> Z.plot() >>> plt.show()
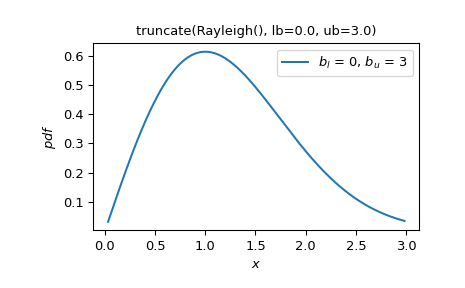
此外,
truncate可以應用於任何隨機變數>>> Rayleigh = stats.make_distribution(stats.rayleigh) >>> W = stats.truncate(Rayleigh(), lb=0, ub=3) >>> W.plot() >>> plt.show()