rotate#
- scipy.ndimage.rotate(input, angle, axes=(1, 0), reshape=True, output=None, order=3, mode='constant', cval=0.0, prefilter=True)[原始碼]#
旋轉陣列。
陣列會在由 axes 參數給定的兩個軸所定義的平面中旋轉,並使用所請求階數的 spline 插值。
- 參數:
- inputarray_like
輸入陣列。
- anglefloat
旋轉角度,以度為單位。
- axestuple of 2 ints, optional
定義旋轉平面的兩個軸。預設值為前兩個軸。
- reshapebool, optional
如果 reshape 為 true,則會調整輸出形狀,使輸入陣列完全包含在輸出中。預設值為 True。
- outputarray or dtype, optional
放置輸出的陣列,或返回陣列的 dtype。預設情況下,將建立與輸入相同 dtype 的陣列。
- orderint, optional
spline 插值的階數,預設值為 3。階數必須在 0-5 範圍內。
- mode{‘reflect’, ‘grid-mirror’, ‘constant’, ‘grid-constant’, ‘nearest’, ‘mirror’, ‘grid-wrap’, ‘wrap’}, optional
mode 參數決定輸入陣列如何在其邊界之外延伸。預設值為 ‘constant’。每個有效值的行為如下 (請參閱 邊界模式 上的其他圖表和詳細資訊)
- ‘reflect’ (d c b a | a b c d | d c b a)
輸入透過反射最後一個像素的邊緣來延伸。此模式有時也稱為半樣本對稱。
- ‘grid-mirror’
這是 ‘reflect’ 的同義詞。
- ‘constant’ (k k k k | a b c d | k k k k)
輸入透過使用相同的常數值 (由 cval 參數定義) 填充邊緣之外的所有值來延伸。在輸入的邊緣之外不會執行插值。
- ‘grid-constant’ (k k k k | a b c d | k k k k)
輸入透過使用相同的常數值 (由 cval 參數定義) 填充邊緣之外的所有值來延伸。插值也會發生在輸入範圍之外的樣本。
- ‘nearest’ (a a a a | a b c d | d d d d)
輸入透過複製最後一個像素來延伸。
- ‘mirror’ (d c b | a b c d | c b a)
輸入透過反射最後一個像素的中心來延伸。此模式有時也稱為全樣本對稱。
- ‘grid-wrap’ (a b c d | a b c d | a b c d)
輸入透過環繞到相對的邊緣來延伸。
- ‘wrap’ (d b c d | a b c d | b c a b)
輸入透過環繞到相對的邊緣來延伸,但方式是最後一個點和初始點完全重疊。在這種情況下,在重疊點將選擇哪個樣本沒有明確定義。
- cvalscalar, optional
如果 mode 為 ‘constant’,則填充輸入邊緣之外的值。預設值為 0.0。
- prefilterbool, optional
決定是否在插值之前使用
spline_filter預先篩選輸入陣列。預設值為 True,如果order > 1,這將建立一個過濾值的臨時 float64 陣列。如果將此設定為 False,則如果order > 1,輸出將會稍微模糊,除非輸入已預先篩選,也就是說,它是調用原始輸入上的spline_filter的結果。
- 返回:
- rotatendarray
旋轉後的輸入。
註解
對於複數值 input,此函數會獨立旋轉實部和虛部。
Added in version 1.6.0: 新增複數值支援。
範例
>>> from scipy import ndimage, datasets
>>> import matplotlib.pyplot as plt
>>> fig = plt.figure(figsize=(10, 3))
>>> ax1, ax2, ax3 = fig.subplots(1, 3)
>>> img = datasets.ascent()
>>> img_45 = ndimage.rotate(img, 45, reshape=False)
>>> full_img_45 = ndimage.rotate(img, 45, reshape=True)
>>> ax1.imshow(img, cmap='gray')
>>> ax1.set_axis_off()
>>> ax2.imshow(img_45, cmap='gray')
>>> ax2.set_axis_off()
>>> ax3.imshow(full_img_45, cmap='gray')
>>> ax3.set_axis_off()
>>> fig.set_layout_engine('tight')
>>> plt.show()
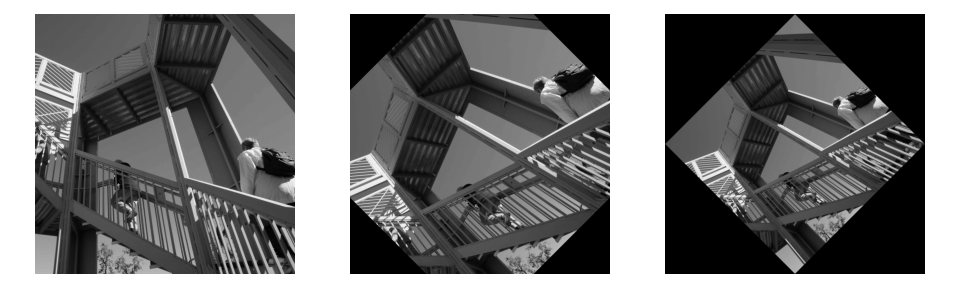
>>> print(img.shape)
(512, 512)
>>> print(img_45.shape)
(512, 512)
>>> print(full_img_45.shape)
(724, 724)