read#
- scipy.io.wavfile.read(filename, mmap=False)[source]#
開啟 WAV 檔案。
回傳取樣率 (samples/sec) 以及來自 LPCM WAV 檔案的資料。
- 參數:
- filename字串或開啟的檔案控制代碼
輸入 WAV 檔案。
- mmapbool,選用
是否將資料讀取為記憶體映射 (預設值:False)。與某些位元深度不相容;請參閱「注意事項」。僅適用於真實檔案。
在版本 0.12.0 中新增。
- 回傳值:
- rateint
WAV 檔案的取樣率。
- datanumpy 陣列
從 WAV 檔案讀取的資料。資料類型由檔案決定;請參閱「注意事項」。對於單聲道 WAV,資料為 1 維,否則為形狀 (Nsamples, Nchannels) 的 2 維。如果傳遞了沒有類似 C 檔案描述符的類檔案輸入 (例如,
io.BytesIO),則這將不可寫入。
注意事項
常見資料類型: [1]
WAV 格式
最小值
最大值
NumPy dtype
32 位元浮點數
-1.0
+1.0
float32
32 位元整數 PCM
-2147483648
+2147483647
int32
24 位元整數 PCM
-2147483648
+2147483392
int32
16 位元整數 PCM
-32768
+32767
int16
8 位元整數 PCM
0
255
uint8
WAV 檔案可以指定任意位元深度,此函式支援讀取從 1 到 64 位元的任何整數 PCM 深度。資料以最小相容的 numpy int 類型傳回,格式為左對齊。8 位元和更低位元為無號數,而 9 位元和更高位元為有號數。
例如,24 位元資料將儲存為 int32,其中 24 位元資料的 MSB 儲存在 int32 的 MSB 中,且通常最低有效位元組為 0x00。(但是,如果檔案實際上包含超過其指定位元深度的資料,這些位元也將被讀取和輸出。[2])
此位元對齊和符號與 WAV 的原生內部格式相符,這允許記憶體映射每個樣本使用 1、2、4 或 8 個位元組的 WAV 檔案(因此 24 位元檔案無法進行記憶體映射,但 32 位元檔案可以)。
支援 32 位元或 64 位元格式的 IEEE 浮點 PCM,無論是否使用 mmap。超出 [-1, +1] 的值不會被裁剪。
不支援非線性 PCM(mu-law、A-law)。
參考文獻
[1]IBM Corporation 和 Microsoft Corporation,“Multimedia Programming Interface and Data Specifications 1.0”,章節 “Data Format of the Samples”,1991 年 8 月 http://www.tactilemedia.com/info/MCI_Control_Info.html
[2]Adobe Systems Incorporated,“Adobe Audition 3 User Guide”,章節 “Audio file formats: 24-bit Packed Int (type 1, 20-bit)”,2007 年
範例
>>> from os.path import dirname, join as pjoin
>>> from scipy.io import wavfile
>>> import scipy.io
從 tests/data 目錄取得範例 .wav 檔的檔名。
>>> data_dir = pjoin(dirname(scipy.io.__file__), 'tests', 'data')
>>> wav_fname = pjoin(data_dir, 'test-44100Hz-2ch-32bit-float-be.wav')
載入 .wav 檔案內容。
>>> samplerate, data = wavfile.read(wav_fname)
>>> print(f"number of channels = {data.shape[1]}")
number of channels = 2
>>> length = data.shape[0] / samplerate
>>> print(f"length = {length}s")
length = 0.01s
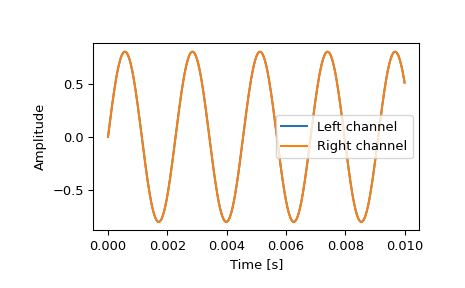
繪製波形圖。
>>> import matplotlib.pyplot as plt
>>> import numpy as np
>>> time = np.linspace(0., length, data.shape[0])
>>> plt.plot(time, data[:, 0], label="Left channel")
>>> plt.plot(time, data[:, 1], label="Right channel")
>>> plt.legend()
>>> plt.xlabel("Time [s]")
>>> plt.ylabel("Amplitude")
>>> plt.show()