scipy.interpolate.
generate_knots#
- scipy.interpolate.generate_knots(x, y, *, w=None, xb=None, xe=None, k=3, s=0, nest=None)[原始碼]#
複製 FITPACK 建構節點向量的過程。
- 參數:
- x, yarray_like
定義曲線
y = f(x)的資料點。- warray_like,選用
權重。
- xbfloat,選用
近似區間的邊界。若為 None(預設),則設為
x[0]。- xefloat,選用
近似區間的邊界。若為 None(預設),則設為
x[-1]。- kint,選用
樣條曲線的次數。預設為立方,
k = 3。- sfloat,選用
平滑化因子。預設為
s = 0。- nestint,選用
當至少放置這麼多節點時停止。
- 產生:
- tndarray
具有遞增節點數量的節點向量。產生器是有限的:當滿足平滑化條件,或當節點數超過最大值時停止:使用者提供的 nest 或 x.size + k + 1 — 這是內插樣條曲線的節點向量。
註解
此常式產生長度遞增的連續節點向量,從
2*(k+1)到len(x) + k + 1,嘗試在 LSQ 樣條曲線與資料偏差大的區域中使節點更密集。當達到最大節點數
len(x) + k + 1時(當s很小且nest很大時會發生這種情況),產生器停止,最後的輸出是不節點邊界條件的內插節點。節點位於資料點位置,除非
k是偶數且節點數為len(x) + k + 1。在這種情況下,產生器的最後輸出在 Greville 位置具有內部節點,(x[1:] + x[:-1]) / 2。在版本 1.15.0 中新增。
範例
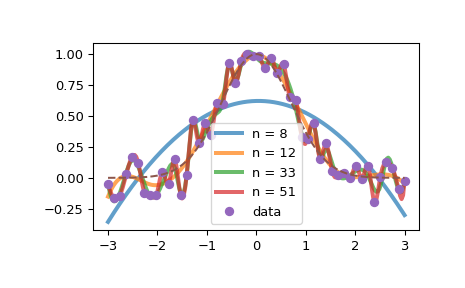
產生一些雜訊資料並擬合一系列 LSQ 樣條曲線
>>> import numpy as np
>>> import matplotlib.pyplot as plt
>>> from scipy.interpolate import make_lsq_spline, generate_knots
>>> rng = np.random.default_rng()
>>> x = np.linspace(-3, 3, 50)
>>> y = np.exp(-x**2) + 0.1 * rng.standard_normal(size=50)
>>> knots = list(generate_knots(x, y, s=1e-10))
>>> for t in knots[::3]:
...     spl = make_lsq_spline(x, y, t)
...     xs = xs = np.linspace(-3, 3, 201)
...     plt.plot(xs, spl(xs), '-', label=f'n = {len(t)}', lw=3, alpha=0.7)
>>> plt.plot(x, y, 'o', label='data')
>>> plt.plot(xs, np.exp(-xs**2), '--')
>>> plt.legend()
請注意,增加節點數量會使結果更緊密地跟隨資料。
另請注意,產生器的一個步驟可能會新增多個節點
>>> [len(t) for t in knots]
[8, 9, 10, 12, 16, 24, 40, 48, 52, 54]