Akima1DInterpolator#
- class scipy.interpolate.Akima1DInterpolator(x, y, axis=0, *, method='akima', extrapolate=None)[原始碼]#
Akima 插值器
擬合分段三次多項式,給定向量 x 和 y。Akima 的插值方法使用由分段三次多項式建構的連續可微分子樣條。結果曲線通過給定的資料點,並且看起來平滑自然。
- 參數:
- xndarray,形狀 (npoints, )
單調遞增實數值的一維陣列。
- yndarray,形狀 (…, npoints, …)
實數值的 N 維陣列。
y沿插值軸的長度必須等於x的長度。使用axis參數來選擇插值軸。- axisint,選用
y陣列中對應於 x 座標值的軸。預設為axis=0。- method{‘akima’, ‘makima’},選用
如果
"makima",則使用修改後的 Akima 插值 [2]。預設為"akima",使用 Akima 插值 [1]。版本 1.13.0 新增。
- extrapolate{bool, None},選用
如果為 bool,則決定是否基於第一個和最後一個間隔外插到超出範圍的點,或返回 NaN。如果為 None,則將
extrapolate設定為 False。
參見
PchipInterpolatorPCHIP 1-D 單調三次插值器。
CubicSpline三次樣條資料插值器。
PPoly係數和斷點方面的分段多項式
註解
版本 0.14 新增。
僅適用於精確資料,因為擬合曲線完全通過給定的點。此常式適用於繪製通過幾個給定點的令人愉悅的平滑曲線以用於繪圖目的。
令 \(\delta_i = (y_{i+1} - y_i) / (x_{i+1} - x_i)\) 為區間 \(\left[x_i, x_{i+1}\right)\) 的斜率。Akima 在 \(x_i\) 的導數定義為
\[d_i = \frac{w_1}{w_1 + w_2}\delta_{i-1} + \frac{w_2}{w_1 + w_2}\delta_i\]在 Akima 插值 [1] (
method="akima") 中,權重為\[\begin{split}\begin{aligned} w_1 &= |\delta_{i+1} - \delta_i| \\ w_2 &= |\delta_{i-1} - \delta_{i-2}| \end{aligned}\end{split}\]在修改後的 Akima 插值 [2] (
method="makima") 中,為了消除過衝並避免分子和分母都等於 0 的邊緣情況,權重修改如下\[\begin{split}\begin{align*} w_1 &= |\delta_{i+1} - \delta_i| + |\delta_{i+1} + \delta_i| / 2 \\ w_2 &= |\delta_{i-1} - \delta_{i-2}| + |\delta_{i-1} + \delta_{i-2}| / 2 \end{align*}\end{split}\]參考文獻
[1] (1,2)一種基於局部程序的新插值和平滑曲線擬合方法。Hiroshi Akima,J. ACM,1970 年 10 月,17(4),589-602。DOI:10.1145/321607.321609
[2] (1,2)Makima 分段三次插值。Cleve Moler 和 Cosmin Ionita,2019 年。https://blogs.mathworks.com/cleve/2019/04/29/makima-piecewise-cubic-interpolation/
範例
method="akima"和method="makima"的比較>>> import numpy as np >>> from scipy.interpolate import Akima1DInterpolator >>> import matplotlib.pyplot as plt >>> x = np.linspace(1, 7, 7) >>> y = np.array([-1, -1, -1, 0, 1, 1, 1]) >>> xs = np.linspace(min(x), max(x), num=100) >>> y_akima = Akima1DInterpolator(x, y, method="akima")(xs) >>> y_makima = Akima1DInterpolator(x, y, method="makima")(xs)
>>> fig, ax = plt.subplots()
>>> ax.plot(x, y, "o", label="data")
>>> ax.plot(xs, y_akima, label="akima")
>>> ax.plot(xs, y_makima, label="makima")
>>> ax.legend()
>>> fig.show()
在
"akima"中發生的過衝已在"makima"中避免。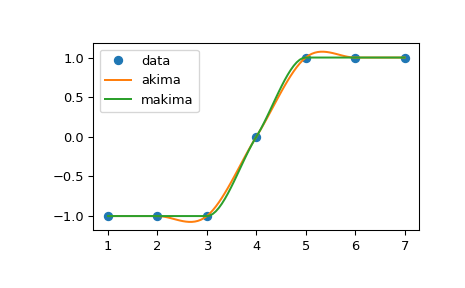
- 屬性:
- axis
- c
- extrapolate
- x
方法
__call__(x[, nu, extrapolate])評估分段多項式或其導數。
derivative([nu])建構表示導數的新分段多項式。
antiderivative([nu])建構表示反導數的新分段多項式。
roots([discontinuity, extrapolate])尋找分段多項式的實根。