tukey_hsd#
- scipy.stats.tukey_hsd(*args)[原始碼]#
執行 Tukey's HSD 檢定以檢驗多組處理間的平均數是否相等。
Tukey 誠實顯著性差異 (HSD) 檢定會對一組樣本的平均數進行成對比較。相較於 ANOVA (例如
f_oneway) 評估每個樣本的真實平均數是否相同,Tukey's HSD 是一種事後檢定,用於比較每個樣本的平均數與其他每個樣本的平均數。虛無假設是樣本底層的分布都具有相同的平均數。檢定統計量 (針對每種可能的樣本配對計算) 僅為樣本平均數之間的差異。對於每對樣本,p 值是在虛無假設 (以及其他假設;請參閱註釋) 下,觀察到如此極端統計量值的機率,並考量到正在執行許多成對比較。平均數之間每對差異的信賴區間也可用。
- 參數:
- sample1, sample2, …array_like
每個群組的樣本測量值。必須至少有兩個引數。
- 回傳值:
- result
TukeyHSDResult實例 回傳值是一個具有以下屬性的物件
- statisticfloat ndarray
檢定計算出的統計量,適用於每次比較。索引
(i, j)處的元素是群組i和群組j之間比較的統計量。- pvaluefloat ndarray
檢定計算出的 p 值,適用於每次比較。索引
(i, j)處的元素是群組i和群組j之間比較的 p 值。
此物件具有以下方法
- confidence_interval(confidence_level=0.95)
計算指定信賴水準的信賴區間。
- result
另請參閱
dunnett執行平均數與對照組的比較。
註釋
此檢定的使用仰賴於數個假設。
觀察值在群組內部和群組之間是獨立的。
每個群組內的觀察值呈常態分布。
樣本取自的分布具有相同的有限變異數。
此檢定的原始公式適用於大小相等的樣本 [6]。若樣本大小不相等,則檢定會使用 Tukey-Kramer 方法 [4]。
參考文獻
[1]NIST/SEMATECH e-Handbook of Statistical Methods, “7.4.7.1. Tukey’s Method.” https://www.itl.nist.gov/div898/handbook/prc/section4/prc471.htm, 28 November 2020.
[2]Abdi, Herve & Williams, Lynne. (2021). “Tukey’s Honestly Significant Difference (HSD) Test.” https://personal.utdallas.edu/~herve/abdi-HSD2010-pretty.pdf
[3]“One-Way ANOVA Using SAS PROC ANOVA & PROC GLM.” SAS Tutorials, 2007, www.stattutorials.com/SAS/TUTORIAL-PROC-GLM.htm.
[4]Kramer, Clyde Young. “Extension of Multiple Range Tests to Group Means with Unequal Numbers of Replications.” Biometrics, vol. 12, no. 3, 1956, pp. 307-310. JSTOR, www.jstor.org/stable/3001469. Accessed 25 May 2021.
[5]NIST/SEMATECH e-Handbook of Statistical Methods, “7.4.3.3. The ANOVA table and tests of hypotheses about means” https://www.itl.nist.gov/div898/handbook/prc/section4/prc433.htm, 2 June 2021.
[6]Tukey, John W. “Comparing Individual Means in the Analysis of Variance.” Biometrics, vol. 5, no. 2, 1949, pp. 99-114. JSTOR, www.jstor.org/stable/3001913. Accessed 14 June 2021.
範例
以下是一些比較三種品牌頭痛藥物緩解時間 (以分鐘為單位) 的資料。資料改編自 [3]。
>>> import numpy as np
>>> from scipy.stats import tukey_hsd
>>> group0 = [24.5, 23.5, 26.4, 27.1, 29.9]
>>> group1 = [28.4, 34.2, 29.5, 32.2, 30.1]
>>> group2 = [26.1, 28.3, 24.3, 26.2, 27.8]
我們想查看任何群組之間的平均數是否顯著不同。首先,以視覺方式檢查盒鬚圖。
>>> import matplotlib.pyplot as plt
>>> fig, ax = plt.subplots(1, 1)
>>> ax.boxplot([group0, group1, group2])
>>> ax.set_xticklabels(["group0", "group1", "group2"])
>>> ax.set_ylabel("mean")
>>> plt.show()
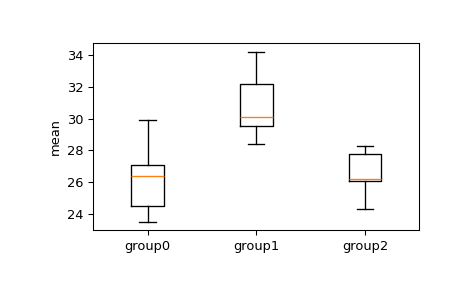
從盒鬚圖中,我們可以看見群組 1 到群組 2 和群組 3 的四分位數間距有重疊,但我們可以應用
tukey_hsd檢定來判斷平均數之間的差異是否顯著。我們設定顯著性水準為 0.05 以拒絕虛無假設。>>> res = tukey_hsd(group0, group1, group2) >>> print(res) Tukey's HSD Pairwise Group Comparisons (95.0% Confidence Interval) Comparison Statistic p-value Lower CI Upper CI (0 - 1) -4.600 0.014 -8.249 -0.951 (0 - 2) -0.260 0.980 -3.909 3.389 (1 - 0) 4.600 0.014 0.951 8.249 (1 - 2) 4.340 0.020 0.691 7.989 (2 - 0) 0.260 0.980 -3.389 3.909 (2 - 1) -4.340 0.020 -7.989 -0.691
虛無假設是每個群組都具有相同的平均數。群組
group0和群組group1以及群組group1和群組group2之間比較的 p 值未超過 0.05,因此我們拒絕它們具有相同平均數的虛無假設。群組group0和群組group2之間比較的 p 值超過 0.05,因此我們接受它們的平均數之間沒有顯著差異的虛無假設。我們也可以計算與我們選擇的信賴水準相關聯的信賴區間。
>>> group0 = [24.5, 23.5, 26.4, 27.1, 29.9]
>>> group1 = [28.4, 34.2, 29.5, 32.2, 30.1]
>>> group2 = [26.1, 28.3, 24.3, 26.2, 27.8]
>>> result = tukey_hsd(group0, group1, group2)
>>> conf = res.confidence_interval(confidence_level=.99)
>>> for ((i, j), l) in np.ndenumerate(conf.low):
...     # filter out self comparisons
...     if i != j:
...         h = conf.high[i,j]
...         print(f"({i} - {j}) {l:>6.3f} {h:>6.3f}")
(0 - 1) -9.480  0.280
(0 - 2) -5.140  4.620
(1 - 0) -0.280  9.480
(1 - 2) -0.540  9.220
(2 - 0) -4.620  5.140
(2 - 1) -9.220  0.540