scipy.spatial.
delaunay_plot_2d#
- scipy.spatial.delaunay_plot_2d(tri, ax=None)[source]#
繪製給定的 2D Delaunay 三角剖分
- 參數:
- triscipy.spatial.Delaunay 實例
要繪製的三角剖分
- axmatplotlib.axes.Axes 實例,選用
要繪製的軸
- 回傳值:
- figmatplotlib.figure.Figure 實例
繪圖的圖形
註解
需要 Matplotlib。
範例
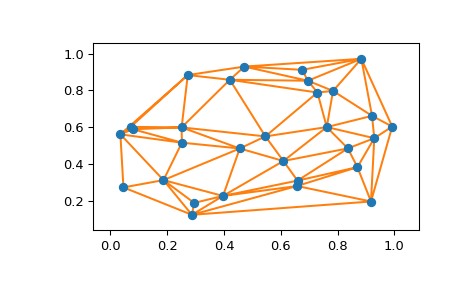
>>> import numpy as np
>>> import matplotlib.pyplot as plt
>>> from scipy.spatial import Delaunay, delaunay_plot_2d
一組隨機點的 Delaunay 三角剖分
>>> rng = np.random.default_rng()
>>> points = rng.random((30, 2))
>>> tri = Delaunay(points)
繪製它
>>> _ = delaunay_plot_2d(tri)
>>> plt.show()