scipy.signal.
detrend#
- scipy.signal.detrend(data, axis=-1, type='linear', bp=0, overwrite_data=False)[source]#
從資料中沿軸向移除線性或常數趨勢。
- 參數:
- dataarray_like
輸入資料。
- axisint, optional
要沿其去除資料趨勢的軸。預設值為最後一個軸 (-1)。
- type{‘linear’, ‘constant’}, optional
去趨勢的類型。如果
type == 'linear'(預設值),則從 data 中減去線性最小平方擬合的結果。如果type == 'constant',則僅減去 data 的平均值。- bparray_like of ints, optional
斷點序列。如果給定,則對 data 在兩個斷點之間的每個部分執行單獨的線性擬合。斷點指定為 data 的索引。此參數僅在
type == 'linear'時有效。- overwrite_databool, optional
如果為 True,則執行就地去趨勢並避免複製。預設值為 False
- 返回:
- retndarray
已去除趨勢的輸入資料。
另請參閱
numpy.polynomial.polynomial.Polynomial.fit建立最小平方擬合多項式。
註解
去趨勢可以解釋為減去最小平方擬合多項式:將參數 type 設定為 ‘constant’ 對應於擬合零次多項式,‘linear’ 對應於一次多項式。請參閱下面的範例。
範例
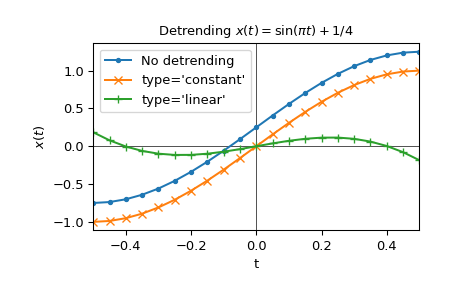
以下範例去除函數 \(x(t) = \sin(\pi t) + 1/4\) 的趨勢
>>> import matplotlib.pyplot as plt
>>> import numpy as np
>>> from scipy.signal import detrend
...
>>> t = np.linspace(-0.5, 0.5, 21)
>>> x = np.sin(np.pi*t) + 1/4
...
>>> x_d_const = detrend(x, type='constant')
>>> x_d_linear = detrend(x, type='linear')
...
>>> fig1, ax1 = plt.subplots()
>>> ax1.set_title(r"Detrending $x(t)=\sin(\pi t) + 1/4$")
>>> ax1.set(xlabel="t", ylabel="$x(t)$", xlim=(t[0], t[-1]))
>>> ax1.axhline(y=0, color='black', linewidth=.5)
>>> ax1.axvline(x=0, color='black', linewidth=.5)
>>> ax1.plot(t, x, 'C0.-',  label="No detrending")
>>> ax1.plot(t, x_d_const, 'C1x-', label="type='constant'")
>>> ax1.plot(t, x_d_linear, 'C2+-', label="type='linear'")
>>> ax1.legend()
>>> plt.show()
或者,NumPy 的
Polynomial也可用於去趨勢>>> pp0 = np.polynomial.Polynomial.fit(t, x, deg=0) # fit degree 0 polynomial >>> np.allclose(x_d_const, x - pp0(t)) # compare with constant detrend True >>> pp1 = np.polynomial.Polynomial.fit(t, x, deg=1) # fit degree 1 polynomial >>> np.allclose(x_d_linear, x - pp1(t)) # compare with linear detrend True
請注意,
Polynomial也允許擬合更高次數的多項式。請查閱其文件以了解如何提取多項式係數。