scipy.interpolate.
NearestNDInterpolator#
- class scipy.interpolate.NearestNDInterpolator(x, y, rescale=False, tree_options=None)[原始碼]#
NearestNDInterpolator(x, y)。
N > 1 維度的最近鄰插值器。
在 0.9 版本中新增。
- 參數:
- x(npoints, ndims) 2-D 浮點數 ndarray
資料點座標。
- y(npoints, ) 1-D 浮點數或複數 ndarray
資料值。
- rescale布林值,選用
在執行內插之前,將點縮放到單位立方體。如果某些輸入維度具有不可比較的單位,並且相差許多數量級,則此功能很有用。
在 0.14.0 版本中新增。
- tree_optionsdict,選用
傳遞到基礎
cKDTree的選項。在 0.17.0 版本中新增。
參見
griddata內插非結構化 D-D 資料。
LinearNDInterpolatorN 維度的分段線性內插器。
CloughTocher2DInterpolator2D 中分段三次、C1 平滑、曲率最小化的內插器。
interpn在規則網格或線性網格上進行內插。
RegularGridInterpolator在任意維度的規則或線性網格上的內插器 (
interpn包裝了這個類別)。
筆記
使用
scipy.spatial.cKDTree注意
對於規則網格上的資料,請改用
interpn。範例
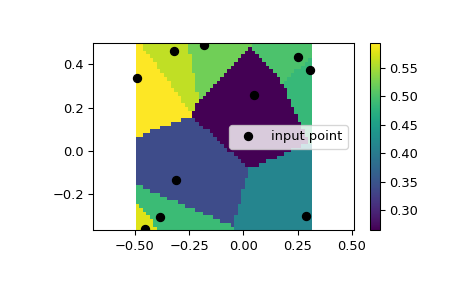
我們可以在 2D 平面上內插值
>>> from scipy.interpolate import NearestNDInterpolator
>>> import numpy as np
>>> import matplotlib.pyplot as plt
>>> rng = np.random.default_rng()
>>> x = rng.random(10) - 0.5
>>> y = rng.random(10) - 0.5
>>> z = np.hypot(x, y)
>>> X = np.linspace(min(x), max(x))
>>> Y = np.linspace(min(y), max(y))
>>> X, Y = np.meshgrid(X, Y)  # 2D grid for interpolation
>>> interp = NearestNDInterpolator(list(zip(x, y)), z)
>>> Z = interp(X, Y)
>>> plt.pcolormesh(X, Y, Z, shading='auto')
>>> plt.plot(x, y, "ok", label="input point")
>>> plt.legend()
>>> plt.colorbar()
>>> plt.axis("equal")
>>> plt.show()
方法
__call__(*args, **query_options)在給定點評估內插器。