electrocardiogram#
- scipy.misc.electrocardiogram()[原始碼]#
載入心電圖作為一維訊號的範例。
返回的訊號是一個 5 分鐘長的心電圖 (ECG),它是心臟電活動的醫學記錄,以 360 Hz 的頻率取樣。
已於版本 1.10.0 棄用:
electrocardiogram已在 SciPy 1.10.0 中從scipy.misc.electrocardiogram棄用,並將在 SciPy 1.12.0 中完全移除。資料集方法已移至scipy.datasets模組。請改用scipy.datasets.electrocardiogram。- 回傳值:
- ecgndarray
以 360 Hz 取樣的心電圖,單位為毫伏特 (mV)。
注意事項
提供的訊號是 PhysioNet [2] 上 MIT-BIH 心律失常資料庫 [1] 提供的 記錄 208(導程 MLII)的摘錄(19:35 至 24:35)。該摘錄包含雜訊引起的偽影、典型的心跳以及病理變化。
新增於版本 1.1.0。
參考資料
[1]Moody GB, Mark RG. The impact of the MIT-BIH Arrhythmia Database. IEEE Eng in Med and Biol 20(3):45-50 (May-June 2001). (PMID: 11446209); DOI:10.13026/C2F305
[2]Goldberger AL, Amaral LAN, Glass L, Hausdorff JM, Ivanov PCh, Mark RG, Mietus JE, Moody GB, Peng C-K, Stanley HE. PhysioBank, PhysioToolkit, and PhysioNet: Components of a New Research Resource for Complex Physiologic Signals. Circulation 101(23):e215-e220; DOI:10.1161/01.CIR.101.23.e215
範例
>>> from scipy.misc import electrocardiogram
>>> ecg = electrocardiogram()
>>> ecg
array([-0.245, -0.215, -0.185, ..., -0.405, -0.395, -0.385])
>>> ecg.shape, ecg.mean(), ecg.std()
((108000,), -0.16510875, 0.5992473991177294)
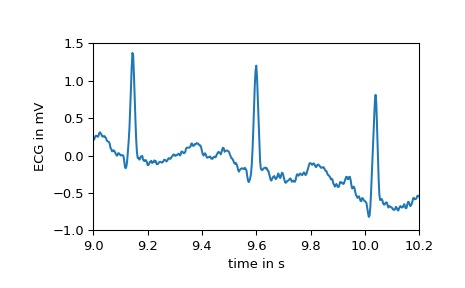
如前所述,該訊號具有幾個不同形態的區域。例如,以下所示的前幾秒顯示了正常竇性心律的心臟電活動。
>>> import numpy as np
>>> import matplotlib.pyplot as plt
>>> fs = 360
>>> time = np.arange(ecg.size) / fs
>>> plt.plot(time, ecg)
>>> plt.xlabel("time in s")
>>> plt.ylabel("ECG in mV")
>>> plt.xlim(9, 10.2)
>>> plt.ylim(-1, 1.5)
>>> plt.show()
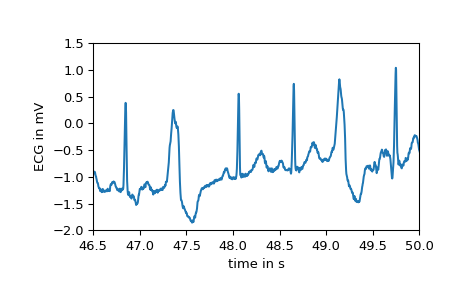
然而,在第 16 秒之後,出現了第一個室性期前收縮,也稱為期外收縮。與典型的心跳相比,這些具有不同的形態。在下圖中可以很容易地觀察到這種差異。
>>> plt.plot(time, ecg)
>>> plt.xlabel("time in s")
>>> plt.ylabel("ECG in mV")
>>> plt.xlim(46.5, 50)
>>> plt.ylim(-2, 1.5)
>>> plt.show()
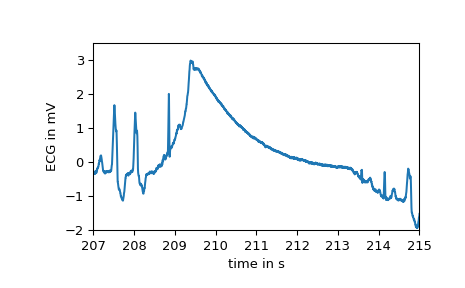
在幾個點上,大的偽影干擾了記錄,例如:
>>> plt.plot(time, ecg)
>>> plt.xlabel("time in s")
>>> plt.ylabel("ECG in mV")
>>> plt.xlim(207, 215)
>>> plt.ylim(-2, 3.5)
>>> plt.show()
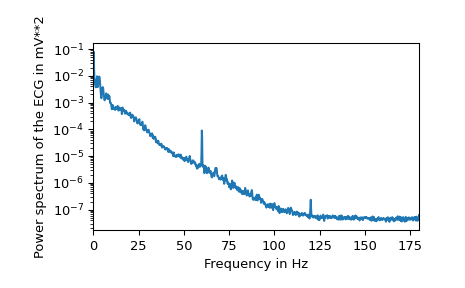
最後,檢視功率頻譜可以發現,生物訊號大部分是由低頻成分組成。在 60 赫茲處,可以清楚地觀察到由市電引起的雜訊。
>>> from scipy.signal import welch
>>> f, Pxx = welch(ecg, fs=fs, nperseg=2048, scaling="spectrum")
>>> plt.semilogy(f, Pxx)
>>> plt.xlabel("Frequency in Hz")
>>> plt.ylabel("Power spectrum of the ECG in mV**2")
>>> plt.xlim(f[[0, -1]])
>>> plt.show()