峰度檢定#
峰度檢定 scipy.stats.kurtosistest 函數檢定虛無假設:樣本取自的母體峰度,與常態分佈的峰度相同。
假設我們希望從測量值推斷,醫學研究中成年男性體重是否不呈常態分佈 [1]。體重(磅)記錄在下方的陣列 x 中。
import numpy as np
x = np.array([148, 154, 158, 160, 161, 162, 166, 170, 182, 195, 236])
來自 [2] 的峰度檢定,首先計算基於樣本(超值/Fisher)峰度的統計量。
from scipy import stats
res = stats.kurtosistest(x)
res.statistic
/home/treddy/github_projects/scipy/doc/build/env/lib/python3.10/site-packages/scipy/stats/_axis_nan_policy.py:586: UserWarning: `kurtosistest` p-value may be inaccurate with fewer than 20 observations; only n=11 observations were given.
  res = hypotest_fun_out(*samples, **kwds)
2.3048235214240873
(檢定警告我們的樣本觀察值太少,無法執行檢定。我們將在本範例結尾再回到這一點。)由於常態分佈的超值峰度為零(根據定義),因此對於從常態分佈中抽取的樣本,此統計量的大小往往較小。
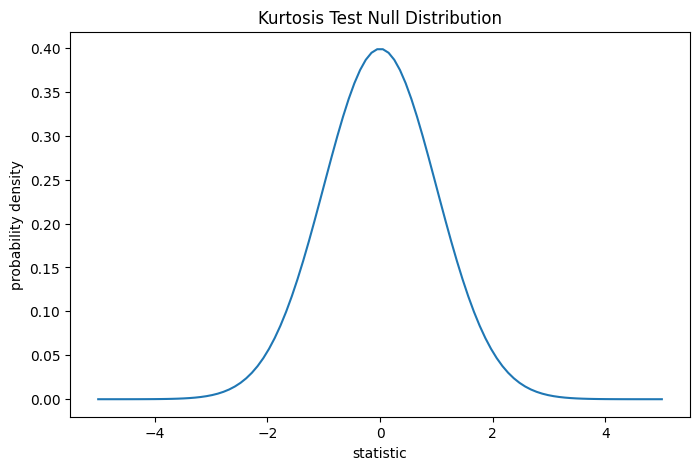
此檢定是透過將觀察到的統計量值,與虛無分佈進行比較來執行:虛無分佈是在虛無假設(體重是從常態分佈中抽取)下,推導出的統計量值分佈。
對於此檢定,非常大樣本的統計量虛無分佈是標準常態分佈。
import matplotlib.pyplot as plt
dist = stats.norm()
kt_val = np.linspace(-5, 5, 100)
pdf = dist.pdf(kt_val)
fig, ax = plt.subplots(figsize=(8, 5))

def kt_plot(ax):  # we'll reuse this
    ax.plot(kt_val, pdf)
    ax.set_title("Kurtosis Test Null Distribution")
    ax.set_xlabel("statistic")
    ax.set_ylabel("probability density")

kt_plot(ax)
plt.show()
此比較以 p 值量化:虛無分佈中,與觀察到的統計量值一樣極端或更極端的值的比例。在雙尾檢定中,如果統計量為正值,則虛無分佈中大於觀察到的統計量的值,以及虛無分佈中小於觀察到的統計量負值的值,都被視為「更極端」。
fig, ax = plt.subplots(figsize=(8, 5))
kt_plot(ax)
pvalue = dist.cdf(-res.statistic) + dist.sf(res.statistic)
annotation = (f'p-value={pvalue:.3f}\n(shaded area)')
props = dict(facecolor='black', width=1, headwidth=5, headlength=8)
_ = ax.annotate(annotation, (3, 0.005), (3.25, 0.02), arrowprops=props)
i = kt_val >= res.statistic
ax.fill_between(kt_val[i], y1=0, y2=pdf[i], color='C0')
i = kt_val <= -res.statistic
ax.fill_between(kt_val[i], y1=0, y2=pdf[i], color='C0')
ax.set_xlim(-5, 5)
ax.set_ylim(0, 0.1)
plt.show()
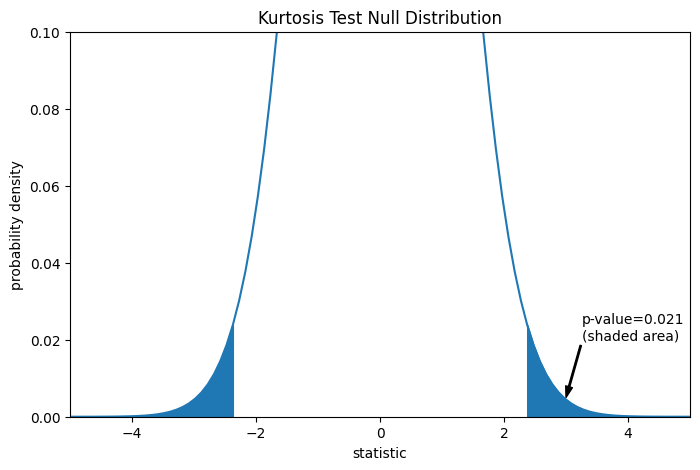
res.pvalue
0.0211764592113868
如果 p 值「很小」——也就是說,如果從常態分佈母體中抽樣資料,產生如此極端統計量值的機率很低——則這可以被視為反對虛無假設,而支持對立假設的證據:體重不是從常態分佈中抽取的。請注意
反之則不然;也就是說,此檢定不用於提供支持虛無假設的證據。
將被視為「小」的值的閾值,應在分析資料之前做出選擇 [3],並考慮到偽陽性(錯誤地拒絕虛無假設)和偽陰性(未能拒絕錯誤的虛無假設)的風險。
請注意,標準常態分佈提供虛無分佈的漸近近似;它僅適用於具有大量觀察值的樣本。這就是我們在範例開頭收到警告的原因;我們的樣本非常小。在這種情況下,scipy.stats.monte_carlo_test 可能提供更準確,儘管是隨機的,精確 p 值近似值。
def statistic(x, axis):
    # get just the skewtest statistic; ignore the p-value
    return stats.kurtosistest(x, axis=axis).statistic
res = stats.monte_carlo_test(x, stats.norm.rvs, statistic)
fig, ax = plt.subplots(figsize=(8, 5))
kt_plot(ax)
ax.hist(res.null_distribution, np.linspace(-5, 5, 50),
        density=True)
ax.legend(['asymptotic approximation\n(many observations)',
           'Monte Carlo approximation\n(11 observations)'])
plt.show()
/home/treddy/github_projects/scipy/doc/build/env/lib/python3.10/site-packages/scipy/stats/_axis_nan_policy.py:586: UserWarning: `kurtosistest` p-value may be inaccurate with fewer than 20 observations; only n=11 observations were given.
  res = hypotest_fun_out(*samples, **kwds)
/home/treddy/github_projects/scipy/doc/build/env/lib/python3.10/site-packages/scipy/stats/_axis_nan_policy.py:618: UserWarning: `kurtosistest` p-value may be inaccurate with fewer than 20 observations; only n=11 observations were given.
  res = hypotest_fun_out(*samples, axis=axis, **kwds)
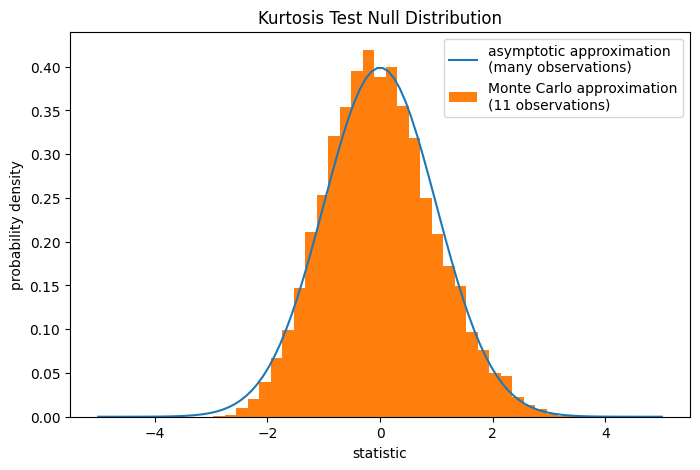
res.pvalue
0.0228
此外,儘管它們具有隨機性,但以這種方式計算的 p 值,可用於精確控制虛無假設的錯誤拒絕率 [4]。