多變量資料在規則網格上的內插 (RegularGridInterpolator)#
假設您在規則網格上擁有 N 維資料,並且想要對其進行內插。在這種情況下,RegularGridInterpolator 會很有用。支援幾種內插策略:最近鄰、線性,以及奇數次張量積樣條。
嚴格來說,此類別有效地處理在正交網格上給定的資料:超立方晶格,點之間可能具有不相等的間距。每個維度的點數對於不同的維度可能有所不同。
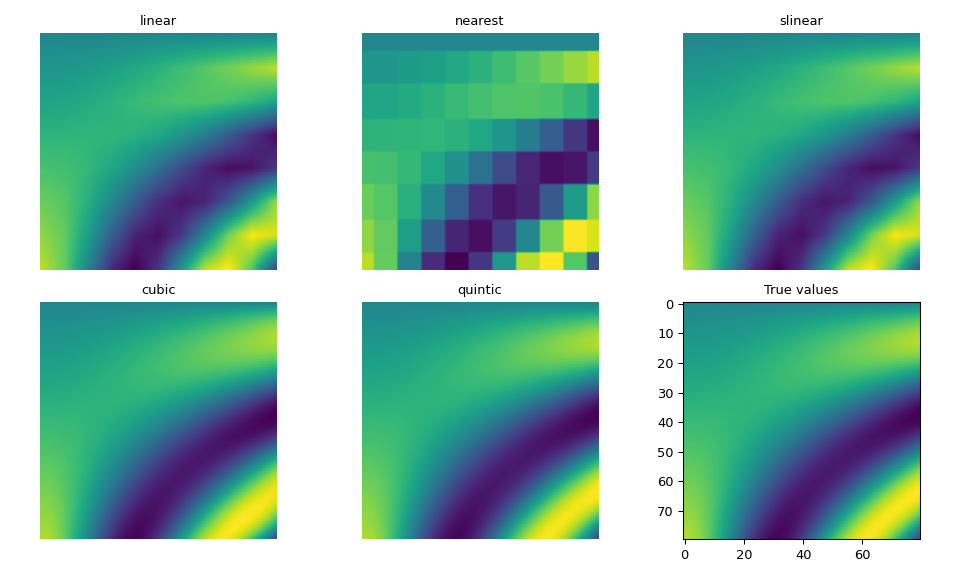
以下範例示範了其用法,並比較了使用每種方法的內插結果。
>>> import numpy as np
>>> import matplotlib.pyplot as plt
>>> from scipy.interpolate import RegularGridInterpolator
假設我們要內插這個 2-D 函數。
>>> def F(u, v):
...     return u * np.cos(u * v) + v * np.sin(u * v)
假設我們只知道規則網格上的一些資料。
>>> fit_points = [np.linspace(0, 3, 8), np.linspace(0, 3, 11)]
>>> values = F(*np.meshgrid(*fit_points, indexing='ij'))
建立測試點和用於評估的真實值。
>>> ut, vt = np.meshgrid(np.linspace(0, 3, 80), np.linspace(0, 3, 80), indexing='ij')
>>> true_values = F(ut, vt)
>>> test_points = np.array([ut.ravel(), vt.ravel()]).T
我們可以建立內插器,並使用每種方法內插測試點。
>>> interp = RegularGridInterpolator(fit_points, values)
>>> fig, axes = plt.subplots(2, 3, figsize=(10, 6))
>>> axes = axes.ravel()
>>> fig_index = 0
>>> for method in ['linear', 'nearest', 'slinear', 'cubic', 'quintic']:
...     im = interp(test_points, method=method).reshape(80, 80)
...     axes[fig_index].imshow(im)
...     axes[fig_index].set_title(method)
...     axes[fig_index].axis("off")
...     fig_index += 1
>>> axes[fig_index].imshow(true_values)
>>> axes[fig_index].set_title("True values")
>>> fig.tight_layout()
>>> fig.show()
正如預期的那樣,較高次數的樣條內插最接近真實值,儘管與linear 或 nearest 相比,計算成本更高。slinear 內插也與 linear 內插相符。
如果您的資料使得樣條方法產生振鈴效應,您可以考慮使用 method="pchip",它使用 PCHIP 內插器的張量積,每個維度一個 PchipInterpolator。
如果您偏好函數式介面而不是顯式建立類別實例,則 interpn 便利函數提供同等的功能。
具體來說,以下兩種形式給出相同的結果
>>> from scipy.interpolate import interpn
>>> rgi = RegularGridInterpolator(fit_points, values)
>>> result_rgi = rgi(test_points)
和
>>> result_interpn = interpn(fit_points, values, test_points)
>>> np.allclose(result_rgi, result_interpn, atol=1e-15)
True
對於限制在 N 維空間的 (N-1) 維子空間中的資料,即當其中一個網格軸的長度為 1 時,沿此軸的外插由 fill_value 關鍵字參數控制
>>> x = np.array([0, 5, 10])
>>> y = np.array([0])
>>> data = np.array([[0], [5], [10]])
>>> rgi = RegularGridInterpolator((x, y), data,
...                               bounds_error=False, fill_value=None)
>>> rgi([(2, 0), (2, 1), (2, -1)])   # extrapolates the value on the axis
array([2., 2., 2.])
>>> rgi.fill_value = -101
>>> rgi([(2, 0), (2, 1), (2, -1)])
array([2., -101., -101.])
注意
如果輸入資料使得輸入維度具有不可公約的單位並且相差許多數量級,則內插器可能具有數值假影。考慮在內插之前重新調整資料的比例。
均勻間隔資料#
如果您正在處理具有整數座標的笛卡爾網格上的資料,例如重新取樣影像資料,則這些常式可能不是最佳選擇。考慮改用 scipy.ndimage.map_coordinates。
對於具有相等間距的網格上的浮點資料,map_coordinates 可以輕鬆地包裝到 RegularGridInterpolator 的外觀中。以下是一個簡化的範例,源自 Johanness Buchner 的「regulargrid」套件
class CartesianGridInterpolator:
    def __init__(self, points, values, method='linear'):
        self.limits = np.array([[min(x), max(x)] for x in points])
        self.values = np.asarray(values, dtype=float)
        self.order = {'linear': 1, 'cubic': 3, 'quintic': 5}[method]

    def __call__(self, xi):
        """
        `xi` here is an array-like (an array or a list) of points.

        Each "point" is an ndim-dimensional array_like, representing
        the coordinates of a point in ndim-dimensional space.
        """
        # transpose the xi array into the ``map_coordinates`` convention
        # which takes coordinates of a point along columns of a 2D array.
        xi = np.asarray(xi).T

        # convert from data coordinates to pixel coordinates
        ns = self.values.shape
        coords = [(n-1)*(val - lo) / (hi - lo)
                  for val, n, (lo, hi) in zip(xi, ns, self.limits)]

        # interpolate
        return map_coordinates(self.values, coords,
                               order=self.order,
                               cval=np.nan)  # fill_value
此包裝器可以用作 RegularGridInterpolator 的(幾乎)直接替換
>>> x, y = np.arange(5), np.arange(6)
>>> xx, yy = np.meshgrid(x, y, indexing='ij')
>>> values = xx**3 + yy**3
>>> rgi = RegularGridInterpolator((x, y), values, method='linear')
>>> rgi([[1.5, 1.5], [3.5, 2.6]])
array([ 9. , 64.9])
>>> cgi = CartesianGridInterpolator((x, y), values, method='linear')
>>> cgi([[1.5, 1.5], [3.5, 2.6]])
array([ 9. , 64.9])
請注意,上面的範例使用 map_coordinates 邊界條件。因此,cubic 和 quintic 內插的結果可能與 RegularGridInterpolator 的結果不同。有關邊界條件和其他額外引數的更多詳細資訊,請參閱 scipy.ndimage.map_coordinates 文件。最後,我們注意到這個簡化的範例假設輸入資料是以升序給出的。